
How to Look Up Chesterfield County Jail Population Data
Jail population data lives in a few official places, not one dashboard. The Chesterfield County Sheriff's Office is the local source, since it runs the jail and reports on it. The Sheriff's annual reports and county news describe daily counts and program results. PREA audit reports give point-in-time capacity and population figures. For broader context, the federal Bureau of Justice Statistics and the Vera Institute publish jail population data at the state and national level.
The Sheriff's Office about page describes the office, its accreditation, and its custody role.
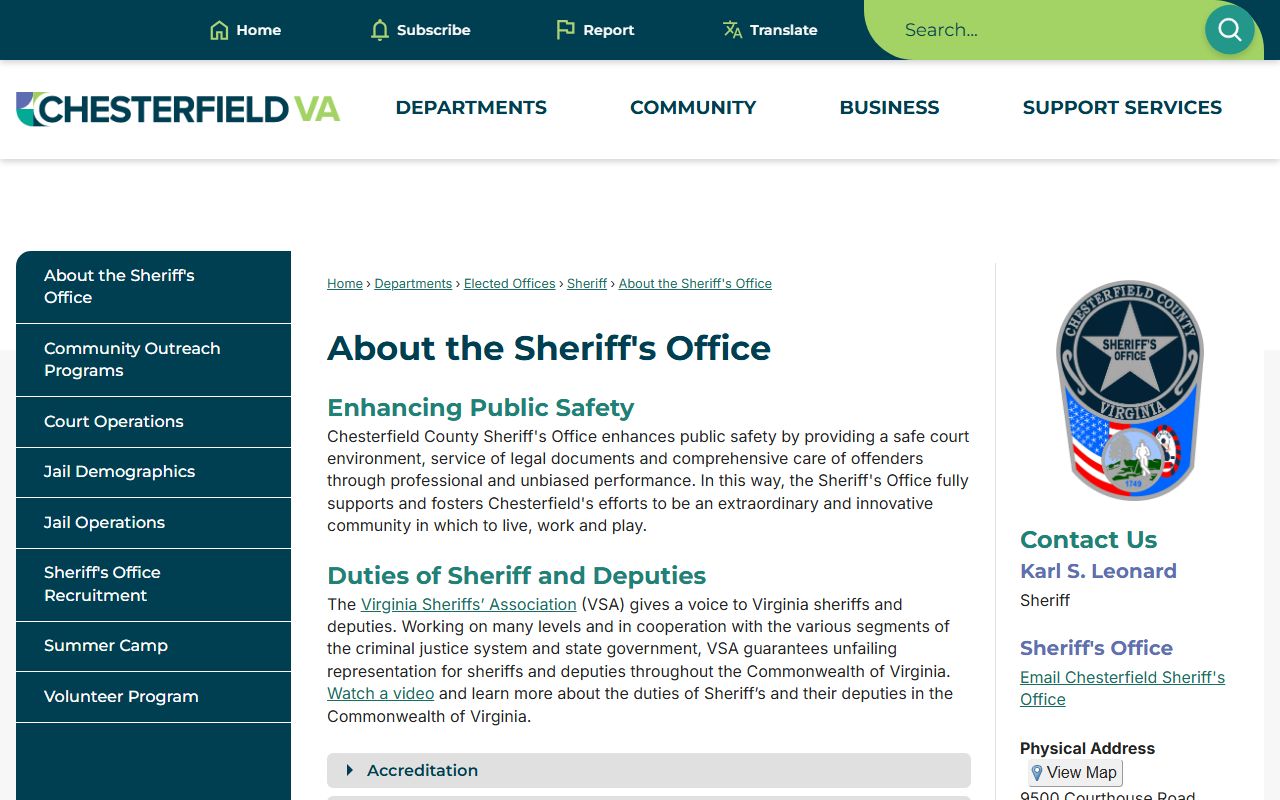
The About the Sheriff's Office page explains the office's duties and its life, health, and safety standards. This page covers facility data; individual name lookups are a different task, covered on the inmate records page.
Chesterfield County Jail Capacity Overview
The Chesterfield County Jail at 6900 Mimms Drive is a medium-security facility with minimum-to-maximum custody levels. A 2016 PREA audit listed the jail's designed capacity at 477 and the population at the time of the audit at 327. That design figure should be read with care. It is the rated capacity from a 2016 audit, not a current operational ceiling after later classification changes, maintenance, or contracted housing decisions.
| Facility | Capacity / Population | Phone | Notes |
|---|---|---|---|
| Chesterfield County Jail | Designed capacity 477; 2016 audit population 327 | 804-748-1476 | Medium security; minimum-to-maximum custody. |
| Riverside Regional Jail (contracted) | Holds Chesterfield inmates by contract | Regional facility | PREA compliant per Chesterfield's 2025 PREA report. |
Note: The 477 figure is a 2016 designed capacity, so it is a reference point rather than today's exact operational limit.
Average Daily Population
The clearest population story in the county is a downward trend. A county article reported that when Sheriff Karl S. Leonard became sheriff in 2014, Chesterfield was responsible for about 1,100 inmates daily. The same article said the average daily population has fallen over the past decade and currently stands at 740. That 740 figure describes the county's broader daily inmate responsibility, which can include people in contracted regional housing, not only those physically inside the Mimms Drive building.
The comparison below sets the key county figures side by side so the trend and the context are clear.
| Figure | Number | What It Means |
|---|---|---|
| 2014 daily responsibility | About 1,100 | Daily inmate count the county was responsible for in 2014. |
| Current average daily population | About 740 | Recent county daily responsibility, including contracted housing. |
| 2016 jail design capacity | 477 | Rated beds in the Mimms Drive jail per the 2016 audit. |
Comparing 740 directly to the 477-bed design is misleading without the contracted-housing context, since the 740 figure spans more than the single building.
Cost Per Inmate Context
Population numbers carry a price. The county article states the state calculates $178 to keep one person in the county jail for one day, which works out to $64,970 a year per person. Against those figures, the drop in average daily population is significant. The county framed the reduction as roughly $23.3 million in annual savings. Those savings are tied to the county's emphasis on alternatives and reentry rather than simply holding more people.
Cost data like this is why population trends matter beyond the jail walls. Fewer people held, when paired with programs that lower the chance of return, lowers the long-run cost to taxpayers. The county connects that math to its workforce, work release, and recovery programs.
The inmate workforce shows the same logic in physical terms. Crews clean highways, county historic sites, courthouses, fairgrounds, and parks, and the county estimates that work alone saves more than $250,000 a year and can support cleanup after a natural disaster. So the population figure is not only a count of beds. It also reflects labor the county would otherwise have to pay for, which is part of how the Sheriff's Office frames the value of its alternatives to straight incarceration.
Pretrial vs Sentenced Population
A jail population is not one group. It is a mix. The Chesterfield jail holds people awaiting trial, people awaiting sentencing, people serving short local sentences, people in work-release or weekender arrangements, and people held for contracted or other reasons. Those categories matter because they affect release timing, program eligibility, and whether a person appears in the state VADOC system.
| Category | What It Means |
|---|---|
| Pretrial | Held while a case is pending, before any finding. |
| Awaiting sentencing | Found guilty but not yet sentenced. |
| Sentenced (local) | Serving a short county sentence. |
| Work release / weekender | Serving time while keeping employment or on weekends. |
Exact local percentages for each category are not published in the sources reviewed. The categories themselves still explain why two people booked the same day can have very different paths.
Demographic and Custody Profile
The county does not publish a detailed public demographic breakdown of the jail population in its standard sources. The 2016 PREA audit did capture a few facility facts. It listed an age range of 18 to 60, a medium-security designation with minimum-to-maximum custody, and 233 staff assigned in the prior 12 months. Those numbers describe the facility as audited, not a live daily snapshot.
The Sheriff's Office landing page sets out the office's mission and overview.
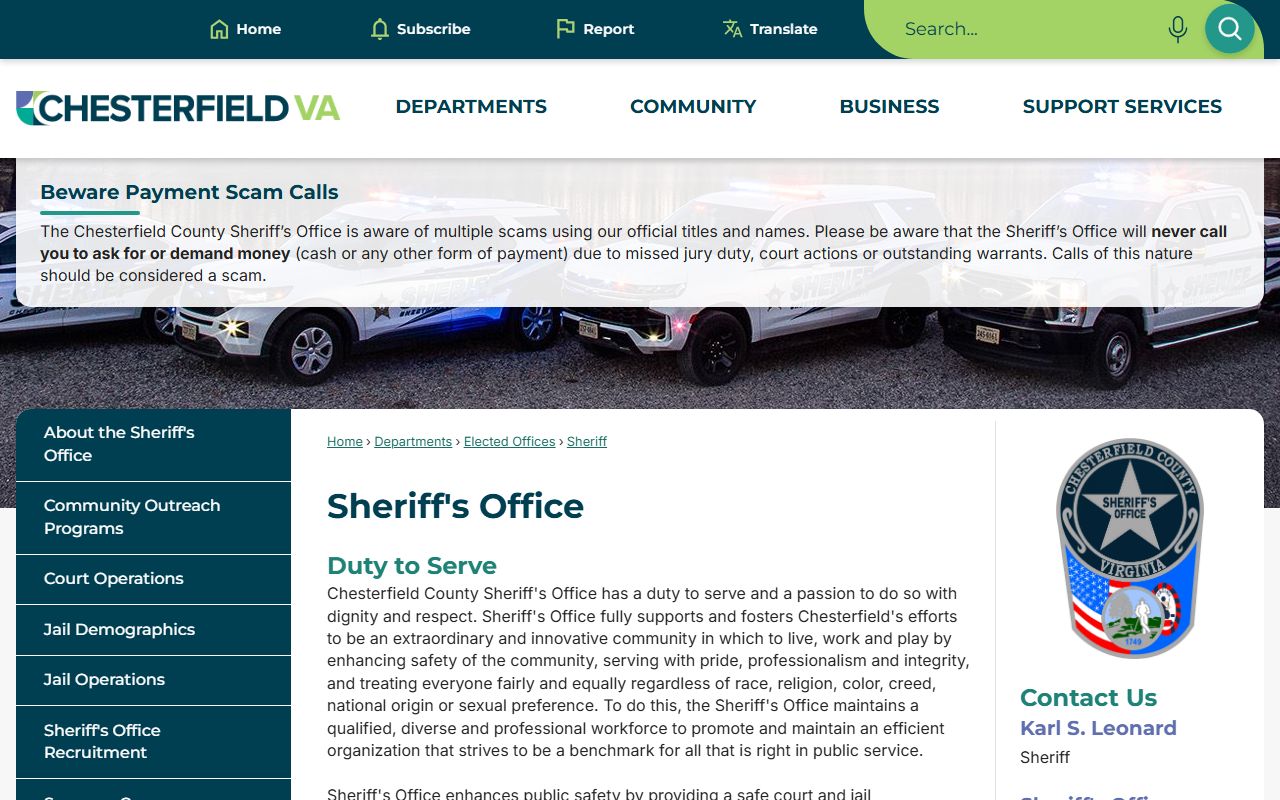
The Sheriff's Office page also carries a payment-scam alert, a reminder that the office never calls to demand money over court matters.
Contracted Regional Housing
Not every Chesterfield inmate sits in the Mimms Drive jail. The county's 2025 PREA report states that Riverside Regional Jail is contracted to hold inmates for the Chesterfield Sheriff's Office and is PREA compliant. Riverside publishes its own PREA report. That contracted housing is part of why the county's daily responsibility figure runs higher than the single jail's design capacity.
Contracted housing is common in Virginia when a county's needs shift or a facility undergoes work. It lets the county manage classification, capacity, and special needs without expanding its own building. It also means a person's physical location can change without changing the county responsible for them. That is one more reason a phone call beats an assumption when you are trying to find where someone is held.
For a search of a specific person who may be in either facility, the Chesterfield County inmate records page explains how to confirm custody by phone and through the state and federal locators.
Programs Behind the Population Drop
The county ties its lower population to program choices. The jail runs an inmate workforce, a weekender workforce, work release, support enforcement, and in-jail recovery programs, including the HARP addiction-recovery program. Sentenced inmates who qualify can shorten time by working, and work release lets eligible nonviolent inmates keep a job while paying child support, court costs, and part of the housing cost. The Sheriff's customer-service standards also list goals of meeting Virginia Department of Corrections life, health, and safety standards and providing medical care, substance-abuse prevention, and job training.
These programs are not just population control. They aim to lower the chance a person returns, which feeds back into both the daily count and the long-run cost. For the program detail and how it affects release, see the released inmates page.
National and State Context
To compare Chesterfield to other places, you need outside data. The federal Bureau of Justice Statistics publishes national jail population reports, and the Vera Institute tracks incarceration trends by county and state. Those sources are the right place for per-capita rates and national comparisons. The research behind this page did not locate a single official table putting Chesterfield's rate next to a state and national rate, so those specific comparisons should be drawn directly from BJS and Vera rather than estimated.
The honest takeaway is that Chesterfield's own documented numbers, the move from about 1,100 to 740 and the cost savings, are stronger evidence than any rough national guess. Use the county figures for the county story and the federal and Vera data for the wider one.
Population Trends and Data Gaps
A full year-by-year chart of Chesterfield's daily population, demographic mix, pretrial-to-sentenced ratio, and average length of stay was not located in the official sources reviewed. That is a real gap. For a numeric, year-over-year view, the better sources are county budget books, Sheriff's annual reports, VADOC jail population reports, and the BJS and Vera datasets named above.
What is clear from the county's own words is the direction. The population responsibility fell over a decade, the county credits its programs, and contracted housing remains part of the system. Those facts are documented, even where the exact annual figures are not posted in one public place.
Reading population data well means watching the source and the date. A 2016 audit number is not a 2026 daily count. A daily responsibility figure is not the same as beds filled in one building. And a national rate from a federal dataset is not a Chesterfield rate. Keeping those distinctions straight is the difference between a fair reading of the numbers and a misleading one.
Searching for Inmate Records by Name
This page covers population data, not individual inmates. To find a specific person, the search runs through the jail by phone and through the state and federal locators. The Chesterfield County inmate records page walks through confirming custody, while the court records page covers the case behind a booking.